
搜索结果: 1-15 共查到“visualization”相关记录43条 . 查询时间(0.225 秒)
Making data visualization more accessible for blind and low-vision individuals(图)
盲人 低视力人士 数据可视化
2022/6/2
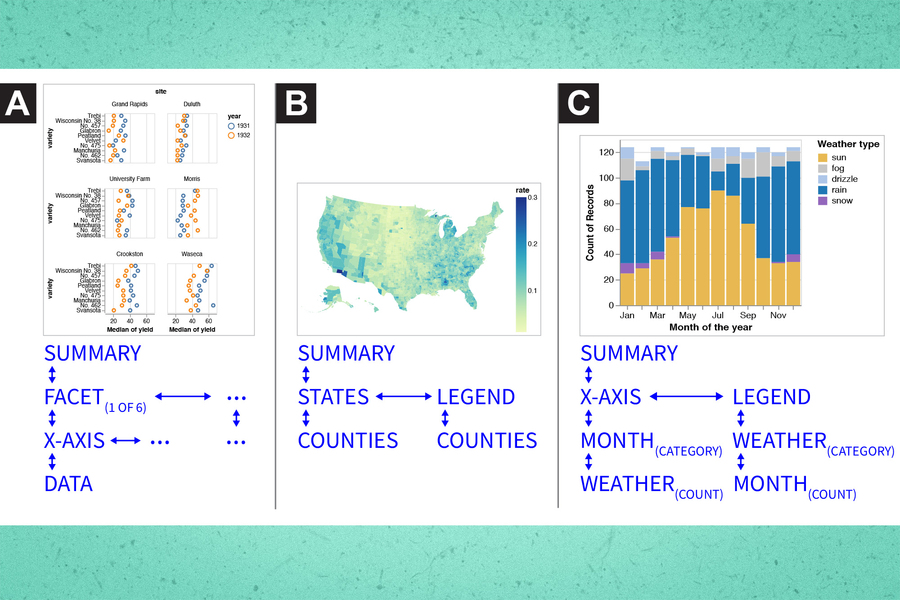
Data visualizations on the web are largely inaccessible for blind and low-vision individuals who use screen readers, an assistive technology that reads on-screen elements as text-to-speech. This exclu...
DEVELOPMENT OF VIRTUAL REALITY APPLICATION FOR CULTURAL HERITAGE VISUALIZATION FROM MULTI-SOURCE 3D DATA
Virtual Reality Visualization Cultural heritage Multi-source data
2019/3/1
Immersive technologies like Virtual or Augmented Reality (VR/AR) are lately becoming more and more popular in wide range of scientific applications. These technologies provide the most immersive way t...
OPTIMIZED ORGANIZATION AND ADAPTIVE VISUALIZATION OF COMPLICATED MOUNTAIN DISASTER 3D SCENES FOR DIVERSE TERMINALS
Mountain Disaster 3D Scenes Adaptive Visualization
2018/9/12
Mountain disaster scenes usually contains various geographical entities, which are dynamic and complicated. Therefore, the construction of mountain disaster 3D scenes has great significance for disast...
DYNAMIC 3D VISUALIZATION OF FLOODS: CASE OF THE NETHERLANDS
Floods 3D visualization CityJSON Cesium 3D webglobe
2018/9/12
In this paper, we review state of the art 3D visualization technologies for floods and we focus on the Netherlands since it has a long history of dealing with floods and developing information technol...
2017年IEEE亚太地区可视化会议(2017 IEEE Pacific Visualization Symposium )(PacificVis)
2017年 IEEE亚太地区可视化 会议
2017/3/27
The 10th IEEE Pacific Visualization Symposium (PacificVis 2017) will be held at Hoam Faculty House, Seoul National University, Seoul, Korea during April 18 to 21, 2017. As part of PacificVis, workshop...
第七届国际3D虚拟重建和复杂建筑可视化研讨会(7th International Workshop on 3D Virtual Reconstruction and Visualization of Complex Architectures)
第七届 3D虚拟重建 复杂建筑 可视化 研讨会
2017/1/18
3D-ARCH is a series of international workshops which started in 2005 in Venice and move throughout the years to Zurich (2007), Trento (2009, 2011, 2013) and Avila (2015), organized as an ISPRS and CIP...
This paper reports on user experience with Tioga, a DBMScentric visualization tool developed at Berkeley. Based on this experience, we have designed Tioga-2 as a direct manipulation system that is mor...
Tioga-2: A Direct Manipulation Database Visualization Environment.
Tioga-2 Direct Manipulation Database Visualization Environment.
2016/5/24
This paper reports on user experience with Tioga, a DBMS-centric visualization tool developed at Berkeley. Based on this experience, we have designed Tioga-2 as a direct manipulation system that is mo...
Non-Invasive Interactive Visualization of Dynamic Architectural Environments
Visualization Exploded View Architecture
2016/5/24
We present a system for interactively producing exploded views of
3D architectural environments such as multi-story buildings. These
exploded views allow viewers to simultaneously see the internal
...
Graphical Histories for Visualization: Supporting Analysis, Communication, and Evaluation
Visualization history undo analysis presentation evaluation
2016/5/24
Interactive history tools, ranging from basic undo and redo to branching timelines of user actions, facilitate iterative
forms of interaction. In this paper, we investigate the design of history mech...
RICH INTERACTIVE MAPPING EXPERIENCE THROUGH OPEN SOURCE FRAMEWORKS AND AJAX DATA VISUALIZATION TECHNIQUES
Online mapping data visualization regional urban indicators
2016/2/29
Community indicator projects across America seek to understand and analyze the inter-relationships of multiple issues over a given
geographic area, typically within an urban region or city. While map...
Red Relief Image Map: New Visualization Method for Three Dimensional Data
LIDAR Application Visualization DEM/DTM Graphics Representation
2015/12/3
The vast increase of the volume of three dimensional topographic data acquired by Airborne LIDAR extends the possibility of the visualization method. The maximum laser pulse frequency of modern LIDAR ...
Pyramid Management and Real-time Visualization of Massive 3-Dimensional Terrain Data
Visualization Level of Detail Computer Vision Simulation Geography
2015/12/3
3-Dimensional terrain visualization has been widely used in the fields, such as games, geographic information system (GIS), remote sensing (RS) and virtual reality (VR). Rendering large scale 3D terra...
Communication and Visualization of 3D Urban Spatial Data According to User Requirements: Case Study of Geneva
urban data three-dimensional user requirements modelling visualization LIDAR
2015/12/2
In 2005, the main commission of the technical services of the city of Geneva launched a study to evaluate which users would potentially be interested to integrate the third dimension in the available ...
Integration of LIDAR and Airborne Imagery for Realistic Visualization of 3D Urban Environments
LiDAR Georeferencing True Orthophoto Generation 3D Visualization Urban Environments
2015/12/2
In its report "State of the World Cities 2006/07", the United Nations states that the number of urban area inhabitants is expected to rise to almost 5 billion by 2030, constituting roughly 62% of the ...